Household Retirement Fund chartfor Middle Aged Adults 49 years old
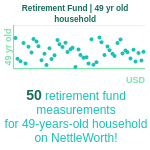
Average Retirement Fund for 49 year old households
For most 49 year old households in America, Retirement Fund measurements fall between $52,239 and $298,508. The median Retirement Fund for households in this age group is $149,254, according to the Federal Reserve's 2022 Survey of Consumer Finances and anonymized data from users.All Results
Enter your Retirement Fund measurements above to see how they compare
So far, we have recorded 0 Retirement Fund measurements for 49 year old households on NettleWorth!
(chart updates daily)
Chart Insights
At 49, with retirement closer than it has ever been, does your fund balance give you confidence about what the next chapter holds? The median retirement fund balance for 49-year-old households stands at $115,000, with most households in this group holding between $40,250 at the 25th percentile and $264,500 at the 75th percentile. Household retirement savings reflects the combined balances of all earners in the household, meaning two-income households typically have significantly more saved than the individual figures suggest. Vanguard's 2025 data shows a median 401(k) balance of $67,796 for the 45-54 age group. The Federal Reserve's broader retirement savings measure, which includes IRAs and defined benefit plans, puts the household median for this bracket at $115,000. The average retirement fund balance is considerably higher than the median at approximately $322,000, driven by a small number of high earners and long-term savers whose balances are not representative of the typical experience. NettleWorth uses the median because it reflects where most households your age actually stand, not a figure inflated by outliers at the top of the distribution.
Milestones and Peer Comparisons
At 49, most households are in or approaching their peak earning years and should be contributing at the highest rates of their careers. A retirement balance around $115,000 is typical; those above $264,500 are on track for a financially comfortable retirement. Fidelity's widely used retirement benchmark suggests having approximately 4-5x of your annual salary saved by 49. At 50, catch-up contributions become available - an additional $8,000 annually to a 401(k) and $1,000 to an IRA - a provision that is specifically designed for households who are approaching retirement and want to accelerate their savings. Having a retirement fund around $115,000 places your household at the median for 49-year-old households, while a balance above $264,500 puts your household in the top quarter of your household's age group.
Tips and Growth Factors
At 49, you are approaching or in the highest-income years of your career, and your retirement savings rate should reflect that. The 2026 401(k) contribution limit is $23,500; maximize it. At 50, catch-up contributions allow an additional $8,000 per year to your 401(k) (total: $31,500) and an additional $1,000 to your IRA (total: $8,000). Plan your finances around taking full advantage of these provisions as soon as they become available. If your income exceeds the Roth IRA contribution limit, the backdoor Roth conversion strategy allows you to access Roth tax benefits regardless of income. A target retirement fund balance of $264,500 or above by the time you reach 50 gives you exceptional compound growth runway across the final pre-retirement years.
Data Sources and Methodology
All statistics on this page are derived from reputable sources, including the Federal Reserve's Survey of Consumer Finances, anonymized data from NettleWorth users, and our own research.
Retirement fund percentiles presented on this page are generated using a robust, age-based modeling framework calibrated to reflect realistic patterns of retirement savings accumulation and drawdown throughout the lifespan. The approach applies smoothing techniques calibrated to align with Federal Reserve Survey of Consumer Finances data and Vanguard participant data. We use a range of separate percentiles (from the 2nd to the 99th) that are calculated for every age and demographic group, with demographic adjustments built into the model to reflect currently observed population-level trends.
Primary data sources include the Federal Reserve's Survey of Consumer Finances (2022 release), Vanguard's How America Saves (2025 edition), Fidelity Investments Q4 2024 retirement analysis, and the Investment Company Institute Fact Book. Retirement fund figures are specified for U.S. residents in USD and follow the percentile structure used in our calculations.
Further details on our assumptions and our transparent methodology are described in our documentation for those seeking deeper insight into the modeling process and its limitations. Get in touch to discuss further or if you believe an error has been made somewhere.
See more ages