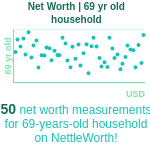
Household Net Worth chart for Retirees 69 years old

Average net worth for 69 year old household
For most 69 year old household in America, net worth measurements fall between $191,213 and $1,365,808 USD. The median net worth for household in this age group is $546,323 USD, according to the Federal Reserve's 2022 Survey of Consumer Finances and anonymized data from users.
All Results
Enter your net-worth measurements above to see how they compare
So far, we have recorded 0 Net Worth measurements for 69-year-old household on NettleWorth!
(chart updates daily)
Chart Insights
At 69, is the net worth your household has accumulated genuinely working hard enough for the retirement years ahead? The median net worth for 69-year-old households stands at $546,323, with most households in this group holding between $191,213 at the 25th percentile and $1,365,808 at the 75th percentile. The spread between the 25th and 75th percentile at this stage reflects how differently retirement has unfolded for households at 69, depending on the wealth accumulated, income sources established, and spending patterns adopted. The average net worth is considerably higher than the median at $1,092,646, driven by a relatively small number of exceptionally wealthy households whose financial circumstances - large inherited estates, successful business sales, or decades of high-income accumulation - are not representative of where most 69-year-old households actually stand. NettleWorth uses the median to give your household the most honest and grounded benchmark available: the exact midpoint where half of your peer households hold more and half hold less, without distortion from outliers whose reality has no bearing on yours.
Milestones and Peer Comparisons
At 69, most households are in active retirement and managing the transition from accumulation to distribution. Social Security, required minimum distributions, pension income where applicable, and portfolio withdrawals are the core income sources, and the financial priority has shifted from growing net worth to sustaining it efficiently. A household net worth around $546,323 at 69 is typical; above $1,365,808 provides substantial financial security for the full length of retirement. Having a net worth around $546,323 places your household right at the median for 69-year-old households, while a net worth above $1,365,808 puts your household in the top quarter of your household's age group.
Tips and Growth Factors
At 69, most households have transitioned from building wealth to managing it sustainably across a long retirement. The priority is ensuring your withdrawal strategy is structured to minimize taxes and maximize the longevity of your assets. A common framework is the 4% rule - withdrawing no more than 4% of portfolio value annually - though households with significant guaranteed income from pensions or Social Security may have more flexibility. Review your asset allocation to ensure it balances growth (to outpace inflation) with stability (to absorb market volatility). A portfolio with 50-60% equities remains appropriate for most households at this stage given the potentially long retirement horizon. Estate planning - updated wills, beneficiary designations, and powers of attorney - ensures that the wealth built over a lifetime is distributed according to your intentions.
Data Sources and Methodology
All statistics on this page are derived from reputable sources, including the Federal Reserve's Survey of Consumer Finances, anonymized data from NettleWorth users, and our own research.
Net worth percentiles presented on this page are generated using a robust, age-based modeling framework designed to reflect realistic patterns of wealth accumulation throughout the lifespan. The approach applies a double exponential smoothing technique, calibrated to match Federal Reserve Survey of Consumer Finances data. Our data spans the earning and retirement life stages from adolescence through late retirement. We use a range of separate percentiles (from the 2nd to the 99th) that are calculated for every age and demographic group, with demographic adjustments built into the model to reflect currently observed population-level trends.
Primary data sources include the Federal Reserve's Survey of Consumer Finances (2022 release), Distributional Financial Accounts, IRS Personal Wealth Statistics, and leading financial research from the Federal Reserve, IRS, and Vanguard. Net worth figures are specified for U.S. residents in USD and follow the original percentile structure used in our calculations.
Further details on our assumptions and our transparent methodology are described in our documentation for those seeking deeper insight into the modeling process and its limitations. Get in touch to discuss further or if you believe an error has been made somewhere.
See more ages