Household Retirement Fund chartfor Late Middle Aged Adults 60 years old
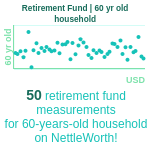
Average Retirement Fund for 60 year old households
For most 60 year old households in America, Retirement Fund measurements fall between $104,339 and $596,221. The median Retirement Fund for households in this age group is $298,110, according to the Federal Reserve's 2022 Survey of Consumer Finances and anonymized data from users.All Results
Enter your Retirement Fund measurements above to see how they compare
So far, we have recorded 0 Retirement Fund measurements for 60 year old households on NettleWorth!
(chart updates daily)
Chart Insights
At 60, with retirement either here or imminent, is your fund balance positioned to sustain the income and lifestyle you have planned for? The median retirement fund balance for 60-year-old households stands at $209,000, with most households in this group holding between $73,150 at the 25th percentile and $480,699 at the 75th percentile. Household retirement savings reflects the combined balances of all earners in the household, meaning two-income households typically have significantly more saved than the individual figures suggest. Vanguard's 2025 report shows a median 401(k) balance of $95,642 for the 55-64 age group. The Federal Reserve's Survey of Consumer Finances, which captures all retirement accounts, shows the broader household median for this bracket at $185,000. The average retirement fund balance is considerably higher than the median at approximately $585,200, driven by a small number of high earners and long-term savers whose balances are not representative of the typical experience. NettleWorth uses the median because it reflects where most households your age actually stand, not a figure inflated by outliers at the top of the distribution.
Milestones and Peer Comparisons
At 60, most households are either at or approaching retirement, and the retirement fund balance at this stage is one of the primary determinants of financial security for the decades ahead. A balance around $209,000 is typical; those above $480,699 have substantial retirement security. Fidelity's widely used retirement benchmark suggests having approximately 8x of your annual salary saved by 60. Understanding your full income picture in retirement - Social Security, any pension, retirement account withdrawals, and potential part-time income - allows you to determine whether your current balance is sufficient or whether adjustments to spending, savings, or retirement timing are warranted. Having a retirement fund around $209,000 places your household at the median for 60-year-old households, while a balance above $480,699 puts your household in the top quarter of your household's age group.
Tips and Growth Factors
At 60, the focus shifts from accumulation to transition planning. Maximize all remaining pre-retirement contributions, including catch-up provisions, and begin the detailed planning work that will define your retirement income structure. Calculate your expected income from all sources: Social Security (run a detailed estimate at ssa.gov), any pension benefits, portfolio withdrawals based on the 4% guideline, and any part-time income plans. Healthcare is typically the largest unplanned expense in early retirement: understand your options for coverage between retirement and Medicare eligibility at 65, and factor those costs explicitly into your retirement budget. A retirement balance above $480,699 at 60 provides genuine flexibility about timing and lifestyle in retirement.
Data Sources and Methodology
All statistics on this page are derived from reputable sources, including the Federal Reserve's Survey of Consumer Finances, anonymized data from NettleWorth users, and our own research.
Retirement fund percentiles presented on this page are generated using a robust, age-based modeling framework calibrated to reflect realistic patterns of retirement savings accumulation and drawdown throughout the lifespan. The approach applies smoothing techniques calibrated to align with Federal Reserve Survey of Consumer Finances data and Vanguard participant data. We use a range of separate percentiles (from the 2nd to the 99th) that are calculated for every age and demographic group, with demographic adjustments built into the model to reflect currently observed population-level trends.
Primary data sources include the Federal Reserve's Survey of Consumer Finances (2022 release), Vanguard's How America Saves (2025 edition), Fidelity Investments Q4 2024 retirement analysis, and the Investment Company Institute Fact Book. Retirement fund figures are specified for U.S. residents in USD and follow the percentile structure used in our calculations.
Further details on our assumptions and our transparent methodology are described in our documentation for those seeking deeper insight into the modeling process and its limitations. Get in touch to discuss further or if you believe an error has been made somewhere.
See more ages