Female Annual Income chartfor Middle Aged Adults 49 years old
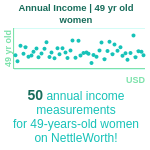
Average Annual Income for 49 year old women
For most 49 year old women in America, Annual Income measurements fall between US$55,444 and US$133,066. The median Annual Income for women in this age group is US$92,407, according to the Federal Reserve's 2022 Survey of Consumer Finances and anonymised data from users.All Results
Enter your Annual Income measurements above to see how they compare
So far, we have recorded 0 Annual Income measurements for 49 year old women on NettleWorth!
(chart updates daily)
Chart Insights
At 49, have you reached the income levels that make genuine financial independence within the next decade a real possibility? The median annual income for 49-year-old women stands at $53,300, with most women in this group earning between $25,584 at the 25th percentile and $93,275 at the 75th percentile. Peak earning years for most occupations fall within the 40-55 age range, and the gap between the 25th and 75th percentile at this age reflects both the career advancement that some have achieved and the plateaus that others are navigating. Women earn approximately 83% of what men earn at the same stage, a gap that reflects a combination of occupational concentration, career interruptions for caregiving, and structural pay differences that persist across industries and education levels. The average income is higher than the median at $77,285, pulled upward by high earners in the top decile whose incomes are not representative of the typical experience. NettleWorth uses the median as its primary benchmark because it gives you the most accurate picture of where most women your age actually stand.
Milestones and Peer Comparisons
At 49, women who have maintained career momentum through their thirties are entering their peak earning years. The forties represent the highest-income decade for most women, and the financial decisions made at this income level - particularly around retirement savings rates and investment strategy - have an outsized impact on retirement security. An income around $53,300 is typical; those above $93,275 are in a strong position to close any retirement savings gaps from earlier decades. Earning around $53,300 places you at the median for 49-year-old women, while an income above $93,275 puts you in the top quarter of your age group.
Tips and Growth Factors
At 49, income optimisation and tax efficiency work together as the most powerful financial tools available. Ensure your compensation package is optimised beyond base salary: employer 401(k) match, health savings account contributions, equity compensation, and bonus structures are all part of total compensation that should be fully understood and maximised. A high-deductible health plan combined with a health savings account (HSA) provides triple tax benefits and is one of the most underutilised tax-advantaged savings vehicles available. Consider whether your income level justifies specialised tax planning - a certified financial planner can often identify tax strategies that recapture more than the cost of advice annually.
Data Sources and Methodology
All statistics on this page are derived from reputable sources, including the Federal Reserve's Survey of Consumer Finances, anonymised data from NettleWorth users, and our own research.
Annual income percentiles presented on this page are generated using a robust, age-based modelling framework calibrated to reflect realistic patterns of income growth, peak earning, and post-retirement income across the lifespan. The approach applies smoothing techniques aligned with Bureau of Labour Statistics and Census Bureau income data. We use a range of separate percentiles (from the 2nd to the 99th) that are calculated for every age and demographic group, with demographic adjustments built into the model to reflect currently observed population-level trends.
Primary data sources include the U.S. Bureau of Labour Statistics Current Population Survey (2024), U.S. Census Bureau Current Population Survey Annual Social and Economic Supplement (2024), the Federal Reserve's Survey of Consumer Finances (2022 release), and the Social Security Administration wage index data. Income figures are specified for U.S. residents in USD as gross pre-tax annual income.
Further details on our assumptions and our transparent methodology are described in our documentation for those seeking deeper insight into the modelling process and its limitations. Get in touch to discuss further or if you believe an error has been made somewhere.
See more ages