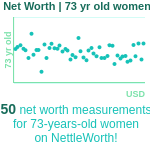
Femme Patrimoine net graphiquepour Retraités 73 ans
Moyenne Patrimoine net pour 73 ans femmes
Pour la plupart des 73 ans femmes en Amérique, les mesures Patrimoine net se situent entre 156 131 $US et 1 115 220 $US. La médiane Patrimoine net pour femmes dans ce groupe d'âge est 446 088 $US, selon l'enquête de 2022 sur les finances des consommateurs de la Réserve fédérale et les données anonymisées des utilisateurs de .Tous les résultats
Saisissez ci-dessus les mensurations de votre Patrimoine net pour comparer les résultats
Jusqu'à présent, nous avons enregistré 0 Patrimoine net mesures pour 73 ans femmes sur NettleWorth !
(le graphique est mis à jour quotidiennement)
Perspectives sur le tableau
À 73 ans, l'indépendance financière que vous avez bâtie vous offre-t-elle réellement la sécurité et la flexibilité requises pour une longue retraite ? La valeur nette médiane des femmes de 73 ans s'élève à 446 088 $, la plupart de ces femmes ayant une valeur nette comprise entre 156 131 $ au 25e percentile et 1 115 220 $ au 75e percentile. L'écart entre le 25e et le 75e percentile à ce stade reflète combien la retraite a évolué différemment pour les femmes de 73 ans, en fonction de la richesse accumulée, des sources de revenus établies et des modèles de dépenses adoptés. La valeur nette moyenne pour ce groupe est nettement plus élevée que la médiane, à 892 176 $, en raison d'un petit nombre de femmes ayant une richesse exceptionnelle - de grands héritages, des rendements d'investissement à long terme extraordinaires ou les produits d'une propriété commerciale significative - dont les circonstances financières ne représentent tout simplement pas la réalité financière que la plupart des femmes rencontrent à 73 ans. NettleWorth utilise la médiane car c'est l'étalon le plus honnête et pratiquement utile disponible : le point médian exact où exactement la moitié de vos pairs détient plus et l'autre moitié moins, vous mesurant donc par rapport au véritable paysage financier des femmes de votre âge.
Jalons et Comparaisons entre Pair
À 73 ans, la plupart des femmes naviguent dans une retraite qui, statistiquement, a encore une durée significative devant elle. Les femmes de 73 ans ont une espérance de vie moyenne qui s'étend dans la moitié à la fin de la quatre-vingtaine, ce qui signifie que la planification financière à ce stade doit prendre en compte potentiellement 20 ans ou plus supplémentaires. Une valeur nette d'environ 446 088 $ à 73 ans est typique ; au-dessus de 1 115 220 $, elle offre la résilience financière nécessaire pour absorber des coûts de santé imprévus et maintenir un style de vie pendant une longue retraite. Avoir une valeur nette d'environ 446 088 $ vous place exactement au niveau médian pour les femmes de 73 ans, tandis qu'une valeur nette supérieure à 1 115 220 $ vous place dans le quart supérieur de votre groupe d'âge.
Conseils et Facteurs de Croissance
À 73 ans, la plupart des femmes gèrent un portefeuille de retraite qui doit soutenir un revenu pendant potentiellement 20 ans ou plus. Les principes financiers les plus importants à ce stade sont la longévité du portefeuille et l'efficacité fiscale. Maintenez une allocation en actions significative - 50-60 % est approprié pour la plupart des femmes de 73 ans - pour garantir que votre portefeuille croît plus rapidement que l'inflation sur toute la durée de la retraite. Les distributions minimales requises des comptes traditionnels (commençant à 73 ans) peuvent faire passer le revenu dans des tranches fiscales plus élevées : les conversions Roth avant ce seuil, le cas échéant, réduisent ce fardeau. La planification des soins de santé et de la dépendance à long terme est la priorité financière ayant le plus grand impact sur la durabilité du portefeuille à cet âge : comprendre vos options Medicare en profondeur et, le cas échéant, évaluer l'assurance soins de longue durée protège la valeur nette que vous avez construite des risques financiers les plus significatifs de la retraite tardive.
Sources de Données et Méthodologie
Toutes les statistiques de cette page proviennent de sources fiables, y compris l'enquête sur les finances des consommateurs de la Réserve fédérale, des données anonymisées des utilisateurs de NettleWorth et nos propres recherches.
Les percentiles de valeur nette présentés sur cette page sont générés en utilisant un cadre de modélisation robuste basé sur l'âge, conçu pour refléter des modèles réalistes d'accumulation de richesse tout au long de la vie. L'approche applique une technique de lissage exponentiel double, calibrée pour correspondre aux données de l'enquête sur les finances des consommateurs de la Réserve fédérale. Nos données couvrent les étapes de la vie professionnelle et de la retraite, de l'adolescence à la retraite tardive. Nous utilisons une gamme de percentiles séparés (du 2e au 99e) qui sont calculés pour chaque tranche d'âge et groupe démographique, avec des ajustements démographiques intégrés dans le modèle pour refléter les tendances observées à l'échelle de la population actuelle.
Les principales sources de données comprennent l'enquête sur les finances des consommateurs de la Réserve fédérale (version 2022), les Comptes financiers distributionnels, les statistiques de richesse personnelle de l'IRS et les recherches financières de premier plan de la Réserve fédérale, de l'IRS et de Vanguard. Les chiffres de valeur nette sont spécifiés pour les résidents américains en USD et suivent la structure de percentiles d'origine utilisée dans nos calculs.
Des détails supplémentaires sur nos hypothèses et notre méthodologie transparente sont décrits dans notre documentation pour ceux qui souhaitent un aperçu plus approfondi du processus de modélisation et de ses limites. Contactez-nous pour en discuter davantage ou si vous pensez qu'une erreur a été commise quelque part.
Voir d'autres tranches d'âge